Most of those who begin trading paper trades begin in one paper trading app, make a couple of trades and then give up in a few weeks, not because it didn’t work, but because they never recorded their trades. If you don’t have any data, you don’t know if it’s a lucky streak or one that can be repeated.
This guide will explain what metrics are followed by professional traders, what pitfalls to avoid and what to look out for when using the best trading app for performance analytics.
What Is Paper Trading and Why Tracking Matters
Paper trading enables you to practice trading in the market with fake money, giving you the opportunity to try out strategies without risking any money. However, it is not simulation that makes you better, it’s tracking.
The Real Purpose of a Virtual Trading Account
There is virtual trading apps to help shorten the learning curve. It allows you to test out different strategies without risking any money, execute the same strategy in a number of trades and discern patterns in your decision making, which a single trade would not be able to show you. Consider it to be a lab, and not a scoreboard.
Why Most Beginners Fail to Improve
Often traders get to a plateau when they simply don’t create a system to look back on what went on. They make some successful trades, they feel good about themselves and never ask themselves why those trades succeeded. If there is no tracking then each session is isolated from the next, and there’s no learning from the session before.
Key Metrics to Track in Your Paper Trading Journal
As a pro trader you should trade like a pro trader, and measure like a pro trader. These are some of the essential numbers to look at.
Win Rate
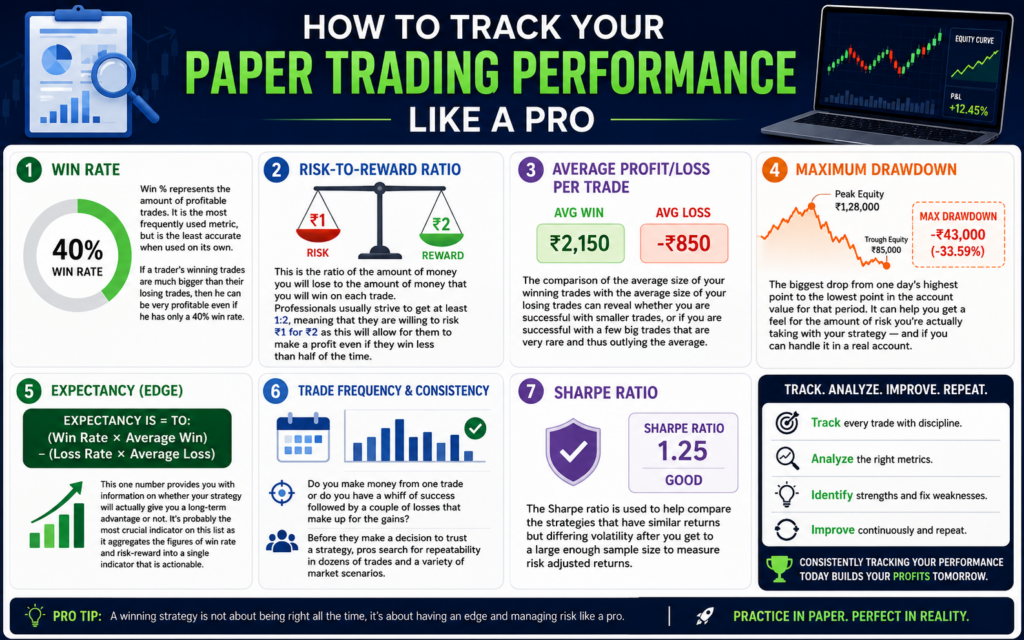
Win % represents the amount of profitable trades. It is the most frequently used metric, but is the least accurate when used on its own. If a trader’s winning trades are much bigger than their losing trades, then he can be very profitable even if he has only a 40% win rate.
Risk-to-Reward Ratio
This is the ratio of the amount of money you will lose to the amount of money that you will win on each trade. Professionals usually strive to get at least 1:2, meaning that they are willing to risk ₹1 for ₹2 as this will allow for them to make a profit even if they win less than half of the time.
Average Profit/Loss Per Trade
The comparison of the average size of your winning trades with the average size of your losing trades can reveal whether you are successful with smaller trades, or if you are successful with a few big trades that are very rare and thus outlying the average.
Maximum Drawdown
The biggest drop from one day’s highest point to the lowest point in the account value for that period. It can help you get a feel for the amount of risk you’re actually taking with your strategy — and if you can handle it in a real account.
Expectancy (Edge)
Expectancy is = to:
(Win Rate × Average Win) − (Loss Rate × Average Loss)
This one number provides you with information on whether your strategy will actually give you a long-term advantage or not. It’s probably the most crucial indicator on this list as it aggregates the figures of win rate and risk-reward into a single indicator that is actionable.
Trade Frequency & Consistency
Do you make money from one trade or do you have a whiff of success followed by a couple of losses that make up for the gains? Before they make a decision to trust a strategy, pros search for repeatability in dozens of trades and a variety of market scenarios.
Sharpe Ratio
The Sharpe ratio is used to help compare the strategies that have similar returns but differing volatility after you get to a large enough sample size to measure risk adjusted returns.
How to Choose the Best Trading App for Performance Tracking
Some platforms don’t provide a simple means to keep track. The best trading app stands out from the rest due to its unique features.
Built-in Analytics Dashboards
Find a platform which calculates win rate, average R:R and drawdown automatically — otherwise, you’ll have to keep track of the numbers in another spreadsheet.
Trade Journaling & Tagging Features
You can tag trades by strategy, setup type and even emotion and then filter your data at a later point to see patterns that you may have missed.
A simple way to stay consistent is using a dedicated trading journal to log entries, exits, and lessons from each trade.
Exportable Reports
You should be able to export a history of your trades from a good virtual trading app that can be read in CSV or PDF files, which can be used to review your activity outside of the app and/or to share with a mentor or trading community.
If you want to take performance tracking a step further, platforms like Market Rush offer structured, rule-based evaluation programs for Indian index traders — helping you assess consistency, discipline, and risk management through detailed analytics, without risking real capital.
Best Practices to Track Like a Pro
Set a Fixed Review Schedule
Check your trades on a weekly or monthly basis not after each and every trade. This will provide you with enough information to see the real trends and not just the noise.
Compare Paper Results vs Real Market Conditions
Keep your paper trades close to reality – with realistic entry/exit conditions, including typical market volatility – and not idealized fills that would not occur while paper trading.
Use a Virtual Trading App With Realistic Slippage & Fees
Many people paper trade in an environment that has no friction, and makes their results look great. Select a paper trading app that will model slippage and commissions that you will actually experience when trading for real.
Common Mistakes to Avoid When Tracking Paper Trades
Ignoring Emotional or Behavioral Notes
Just the numbers don’t tell you if you took it too far or went off course due to fear or confidence. Include brief comments with each trade and your attitude; this information is often more important than the P&L.
Overtrading in a Risk-Free Environment
There’s no money involved, so it’s simple to make many more trades in paper trading as compared to doing so in real trades. This will make your sample size seem larger than it really is, and can make your actual win-rate look off.
Not Testing Across Multiple Market Conditions
When the market is trending, a strategy that works well might not work in a range trading or chopping market. See how you do under all conditions, and then make conclusions about the edge.
FAQs
What’s the most important metric to track in paper trading?
Expectancy, since it combines win rate and risk-reward into a single number that shows whether your strategy has a real long-term edge.
What is the appropriate length of time to paper trade before going live?
Most experienced traders suggest that at least 30-60 trades or 1-3-months of continuous monitoring should be done, before moving to a live account.
How often should I review my paper trading performance?
Weekly or monthly, not after every single trade, so you catch real trends instead of short-term noise.
Which is the most important paper trading criterion?
The most useful of them is the expectancy, which combines risk-reward with win rate.
Does the reality of the trade show up in the paper trading activity?
Not always, as there are emotional and execution issues out there during the live market but consistent metrics measured on paper based trading are a good sign a strategy is viable or not.
How many trades do I need before trusting my metrics?
Most traders consider 30+ trades a reasonable minimum sample size, though 50–100 trades gives a more statistically reliable picture of your win rate and expectancy.
Can I use paper trading data to build a trading plan?
Yes — tracked metrics like expectancy, average R:R, and drawdown are exactly what a solid trading plan should be built around, rather than guesswork or gut feeling.
Final Thoughts
Paper trading isn’t a chore, it’s a way to determine if your trading strategy is successful or not. Pay attention to expectancy, risk to reward, drawdown, and not just win rates alone and consistently check your results.
Looking to apply these measures? Get going with virtual trading for free with a virtual trading app with real-market simulation, trade journaling, and performance analytics.