Most of the beginner readers learn reading charts the hard way – with real money. Paper trading is a smarter way. It allows you to trade with virtual money at actual market prices, trying out various technical analysis techniques, which involves the study of price charts and indicators, to identify trading opportunities. You can practice with patterns, make mistakes and develop discipline with a free paper trading app without risking a rupee. This guide will help you identify the appropriate platform for you, what concepts to start off on, and a six-step process to create actual chart-reading skill.
Paper trading lets you learn technical analysis risk-free: study one stock’s charts using candlesticks, support and resistance, and indicators like RSI and moving averages, then practice virtual trades with a clear stop-loss and review them in a journal before using real money.
Why It Beats Theory Alone
It’s great to learn about candlesticks, but seeing them in a real, disorganized chart is another matter. Paper trading helps to develop pattern recognition, test ideas, and develop emotional discipline in a quick fashion. You also learn how individual things you do (like chasing moves or ignoring stop losses) impact on the results.
Choosing the Best Trading App for Paper Trading Practice
The most feature-rich trading app isn’t the best app to learn about trading on. It’s the one that creates a realistic course of practice and a realistic repetition.
The following are key features to look for:
- Quality charting: Smooth candlestick charts across multiple timeframes
- Indicators and drawing tools: Moving averages, RSI, MACD, trend lines, and support and resistance tools
- Realistic orders: Market, limit, and stop-loss orders
- Live or near-live data: Delayed data can distort how you practise entries
- Performance analytics: Win rate, profit and loss history, and trade logs
Free vs Paid Paper Trading Apps
Most of the beginners will need a paper trading app that is free. The limitation typically shows up in the delay, virtual balance or indicator limits for data. Those limits aren’t a hindrance to learning and if they aren’t a hindrance then there is no need to pay.
Mobile vs Desktop
Mobile apps are great for on-the-go quick practice or chart checks. For more in-depth analysis, and creating detailed chart setups, desktop platforms are better suited. Many Pupil readers are using both.
Core Technical Analysis Concepts to Practise First
Reading Candlestick Charts
On each candle the open, high, low and close of the period will be displayed. Bullish (green) candlesticks end up higher than where they began, bearish (red) candlesticks end lower than where they began. First note a couple of patterns: Doji (candlestick that has no real pattern), Hammer (Pattern that suggests a reversal following a down trend), and Engulfing (A large pattern that represents a significant momentum change).
Support and Resistance
Price levels where buyers are likely to appear are called “support,” whereas “resistance” price levels are where sellers are likely to emerge. Make a chart and note these price levels, observing the reaction. This is the most market-training the exercise you can do yourself.
Trend Lines and Chart Patterns
Join the higher lows together to form an uptrend, lower highs for a downtrend. Then, look for breakouts, when the price violently crosses a trend line or a price level. Paper trade these breakouts and record how many times they fail – these are the lessons to learn!
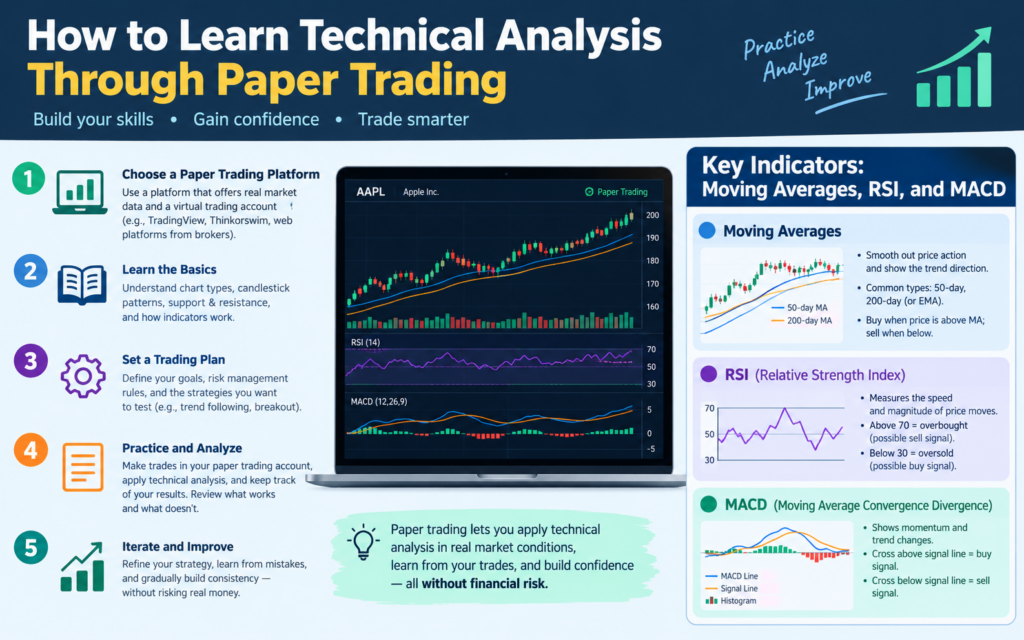
Key Indicators: Moving Averages, RSI, and MACD
- Using moving averages, the price trend would be indicated as up. When the price is above the 50 day moving average, it is a sign of strength.
- RSI (Relative Strength Index) is a measure of momentum. Values of greater than 70 and less than 30 respectively, may indicate overbought and oversold conditions.
- The MACD shows momentum reversal because of the crossing of two lines.
No indicator is infallible, therefore go by the price and double check with other indicators.
A Step-by-Step Plan to Learn Technical Analysis With Paper Trading
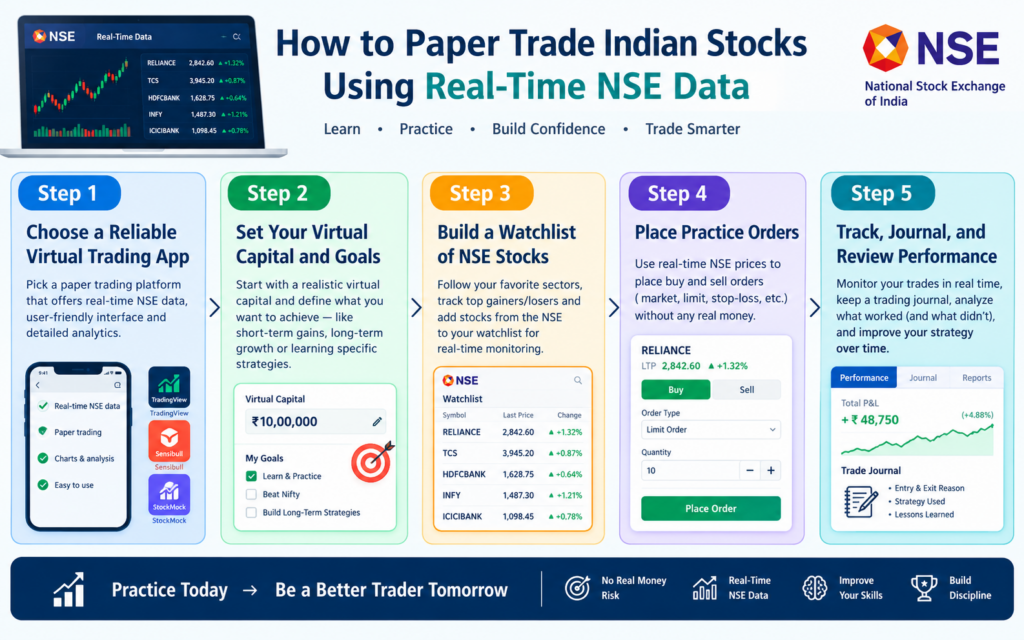
Step 1: Set Up Your Free Paper Trading Account
Download a free paper trading software and practice with a realistic virtual money—approximate balance you would have if you were to invest real money. Too large of a balance will lead to reckless position sizes.
Step 2: Pick One Market and One Timeframe
Never make a “big sell”. Pick one particular major liquid stock or index, and use the daily time frame. The fewer variables there are, the quicker the learning will be.
Step 3: Get one Pattern or Indicator per day.
After learning one tool, take one to two weeks before learning another, e.g. support and resistance. Depth beats breadth.
Step 4: Create a Written Trading Plan
For each trade, record the entry price, the price you are targeting, stop loss price and the number of units. Never risk more than 1-2% of the virtual money you risked on any one trade. A plan makes for actual practice.
Step 5: Keep a Trading Journal
Write the set up, how you got to the solution, the result, and what you learned. It’s a lot more helpful to include a screen shot of the chart in the review. The best record of your progress will be in your journal.
Step 6: Review Weekly and Refine
Review the win/loss percentage, the average risk/reward ratio and the highest drawdown every week. Look for any recurring errors and fine-tune the plan. Learning is not about making additional trades, it’s about reviewing.
Common Mistakes to Avoid When Paper Trading
- Allowing virtual money to be treated in a careless manner: Large size trades develop bad habits.
- Overtrading is a thing that more does NOT equal more learning.
- Overusing indicators: Don’t confuse indicators, they are meant to confirm.
- Without writing in the journal, you’ll be doing the same thing over and over again.
Conclusion
Technical analysis classes are the safest classroom to be: paper trading. You can start learning one concept at a time, practising on a free paper trading app until you get the skill and discipline under your belt and then review your journal weekly, all without risking any money. Once you’re ready to go live, the best trading app will be one that is similar to how you’ve already learned to trade.
How can I learn technical analysis without losing money?
Practise on a free paper trading app, which lets you trade with virtual money at real market prices. Stick to one stock and the daily timeframe, learn one concept at a time, and log every trade in a journal. Move to real money only after you show consistent results.
What is the benefit of using a paper trading app for technical analysis?
It lets you apply charts, indicators and patterns in real market conditions without risking money. You build pattern recognition, test strategies and develop discipline, and your trade logs make weekly reviews easy.
Which technical analysis concepts should beginners learn first?
Start with candlestick basics (open, high, low, close), then support and resistance, and trend lines. Add one indicator, such as the 50-day moving average, only after you are comfortable reading price action.
Can RSI and MACD be trusted for buy and sell signals?
Not on their own. RSI above 70 or below 30 hints at overbought or oversold conditions, and MACD line crossovers hint at momentum shifts, but both often give false signals in strong trends. Use them to confirm what price action already shows.
How do I practise trading breakouts using paper trading?
Mark clear support and resistance levels or trend lines, then place virtual trades when price breaks through with a stop-loss just below the breakout level. Record how many breakouts fail, because spotting false breakouts is a key skill.
How many indicators should I use at one time?
Two or three at most, for example a moving average for trend, RSI for momentum and volume for confirmation. Too many indicators give conflicting signals and lead to confusion.
What is a good stop-loss and risk rule when practising technical analysis?
Place your stop-loss at a logical chart level, such as below support or the recent swing low, and risk no more than 1-2% of your virtual capital on any trade. This builds habits that carry over to real trading.