You’re not the only one who has opened your paper trading dashboard, gazed at a wall of numbers and wondered if you made money or not. The vast majority of people, particularly newbies, look at the number displayed on the green or red LED, think, “Oh, good, that’s normal, or, “Oh, bad, that’s not normal,” and then proceed with their lives without really comprehending the report. This is a habit that can easily transfer in live trading and not reading a P&L report is not only confusing, it can cost you money. Let’s dive in to the paper trading P&L report and dissect it line-by-line and figure out how to develop the habits that lead to more intelligent and confident trading decisions.
What Is a Paper Trading P&L Report?
A P&L (Profit and Loss) report is a summary report of your simulated trades throughout a period of time. It’s supposed to look like a brokerage statement, but it doesn’t have a real risk of losing any money. It’s one of the most neglected attributes a new trader can acquire to understand this report early.
Realized vs. Unrealized Profit/Loss
Realized vs unrealized P&L means that realised P&L is the actual amount of profit or loss that you have made from trades you have executed — meaning that the profit/loss is firm. Unrealized P&L, on the other hand, is the amount of profit or loss from positions that are not yet realized. It may go up or down until you actually hit close the trade, so it’s a prediction, not a guarantee.
Key Metrics Shown on Most P&L Dashboards
Many platforms will report a few key metrics such as net P&L, win rate, average trade size and occasionally have a risk reward ratio. The Net P&L is a number that brings together realized and unrealized elements, which is helpful for a quick look, but can be misleading if one does not take a look at the items included in it.
Breaking Down the Core Sections of a P&L Report
After mastering the basic terminology, it is useful to have an idea of the format of these reports.
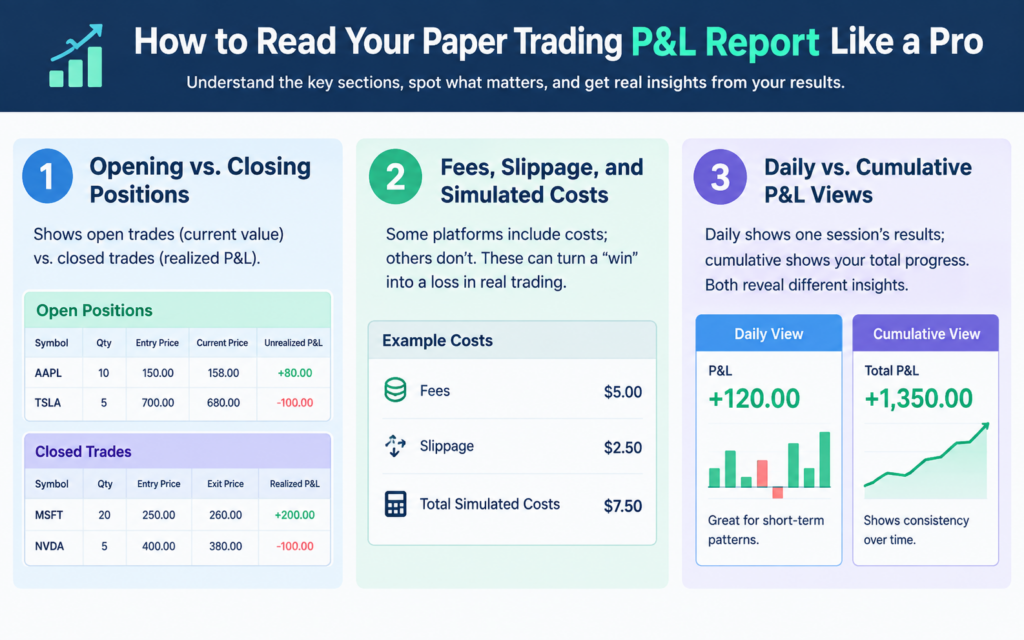
Opening vs. Closing Positions
Each report categorizes positions that are open from closed positions. Open Trades: All of this data is displayed for open trades: how much you entered and how much you are currently simulated to have in the trade. Closed Trades: For closed trades, all of this data is displayed, including how much you have made or lost since you exited the trade.
Fees, Slippage, and Simulated Costs
Some paper trading platforms will model transaction costs such as fees and/or slippage, others will not. This is important because what may seem like a potentially profitable strategy in a no-cost paper scenario could leave you with a loss, once you get more into the real world.
Daily vs. Cumulative P&L Views
The majority of dashboards will provide the ability to switch the view to a daily view or cumulative view. The daily view will display the results of one session and the cumulative view will display the results since you began your tracking. Both are useful but in different ways; daily views are useful to detect the short term patterns; cumulative views are useful to show consistency over a longer period of time.
Choosing a Platform That Reports P&L Clearly
Not all paper trading tools present this information the same way, and that difference matters more than most beginners realize. Some platforms bury key metrics behind extra clicks or use confusing terminology, which makes it harder to build good habits early on. When comparing tools, traders often look for the best trading app that offers transparent, easy-to-read P&L breakdowns rather than cluttered dashboards packed with unnecessary data.
Features That Make the Best Trading App Stand Out for Beginners
A platform popular with the novices usually will provide a simple overview display, easy identification of profit and loss realized and unrealized, and simple charts, not the complicated spreadsheets. Be sure to find those tools that allow you to filter by date range, asset type or trade outcome as this will make it easier to see when there are trends occurring without having to manually trawl through raw data.
Real-Time Updates vs. End-of-Day Summaries
There are some platforms that will show your P&L as the price changes, while others will only give it at the end of the day. For active traders who need to keep an eye on trades, real time updates would be beneficial, but end of day summaries can be more suitable for novices who do not want to get emotional about the in-between swings.
Common Mistakes When Interpreting P&L Reports
With an uncluttered dashboard, it can be easy to get the numbers wrong if you don’t take the time to understand the context.
Confusing Paper Gains With Real Trading Confidence
A major error is believing that when trading paper, you can expect to be successful in the real market. Paper trading lessens the emotional and financial consequences of making a trade, which are a major factor when trading for real.
Ignoring Drawdowns and Risk-Adjusted Returns
Many novices just consider the overall profit amount and don’t pay attention to the dips in the value that occur throughout the strategy. A good strategy may yield a high total return rate but have a lot of serious drops and rises (high volatility) can be much riskier than a strategy that has more moderate returns but fewer serious drops and rises.
How to Use Your P&L Report to Improve Trading Decisions
However, a P&L report is not a scoreboard it’s a tool to improve if used properly.
Setting Benchmarks Before Going Live
First of all, determine specific goals before you take your first steps into real money trading, based on paper trading results, like a goal profit percentage, or a maximum acceptable drawdown. This will provide reliable indicators to assess readiness as opposed to relying on intuition.
Reviewing Trade History Weekly
Take time each week to check in with your closed trades, and see if there are trades that you are losing that have a pattern in terms of asset class, time of day or trade size. Frequently reviewed information becomes insightful.
Conclusion — From Paper Trades to Real Confidence
One of the stealthier abilities traders possess, which can put them ahead of others in their performance, is the ability to read a P&L report correctly. Have the time to understand realised and unrealised gains, monitor your drawdowns and use your reports to learn and improve, not just as a win/lose signal. As you get more at ease with reading these numbers now, you will be better equipped as soon as real capital and real repercussions come into play.
Looking for a challenge in your P&L skills? Sign up for a free paper trading account, and see how you compare with real-time performance.
What does P&L mean in paper trading?
P&L stands for Profit and Loss, showing simulated gains or losses on trades without using real money.
What’s the difference between realized and unrealized P&L?
Realized P&L is profit/loss from closed trades, while unrealized P&L reflects open positions still fluctuating in value.
Why does my paper trading P&L not match real trading results?
Paper trading often lacks real slippage, fees, and emotional pressure, so results can differ from live trading.
How often should I review my P&L report?
Reviewing weekly helps spot patterns in performance without overreacting to daily fluctuations.
Can a paper trading P&L report predict real trading success?
It’s a useful practice tool, but real success also depends on discipline, risk management, and market conditions.